Re: linear-izing the Gann wheel..doing time. *PIC*
I'll never get this explained, I fear. It doesn't matter, I guess, it probably means nothing to anyone but Ganners. My hope first is that it's not wrong. hahah The second is maybe someone can pick it up and advance the ball. My brain is tired.
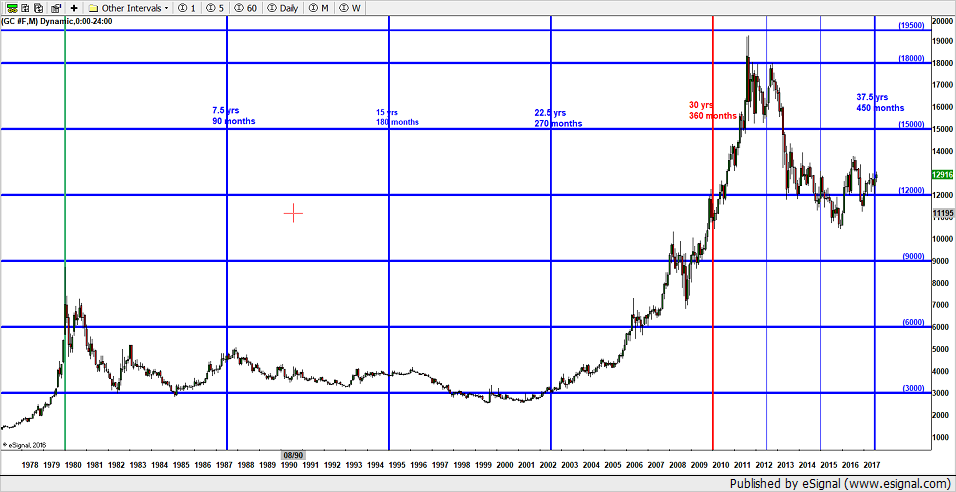
What you do to price you do to time. If you divided price into the critical angles...do the same for time. Mark time off in 30 degree increments...15 degree increments...7.5 degree increments etc. Depending on what time frame you are looking at determines how fine you cut it. This chart, the gold, covers a long period of time. From the 1-80 high(green vertical) you can see the time laid out. 30 years(red longitude line)...the 25 years at the half way point. 7.5 and 22.5 years(where price based off 30 degrees in price for the last time). if this was a Gann wheel marked off in years it would start at 0 and move through 360 years with the first 30 degree/year marked at the red line. At present we passed the 7.5 years into the second 30 degree cycle. From the 1-80 high that is 37.5 degrees in years/ 450 degrees in months.
Since we base the years in 12 month sections it's interesting how nicely that works out between the months and years in Gann numbers. 3.75 degree in years=45 months...7.5 degrees in years=90 degrees in months...15 years=180 months...22,5 years=270 months. Nice.
Think in degrees and you will geometricise(another made up word I think) your charts.