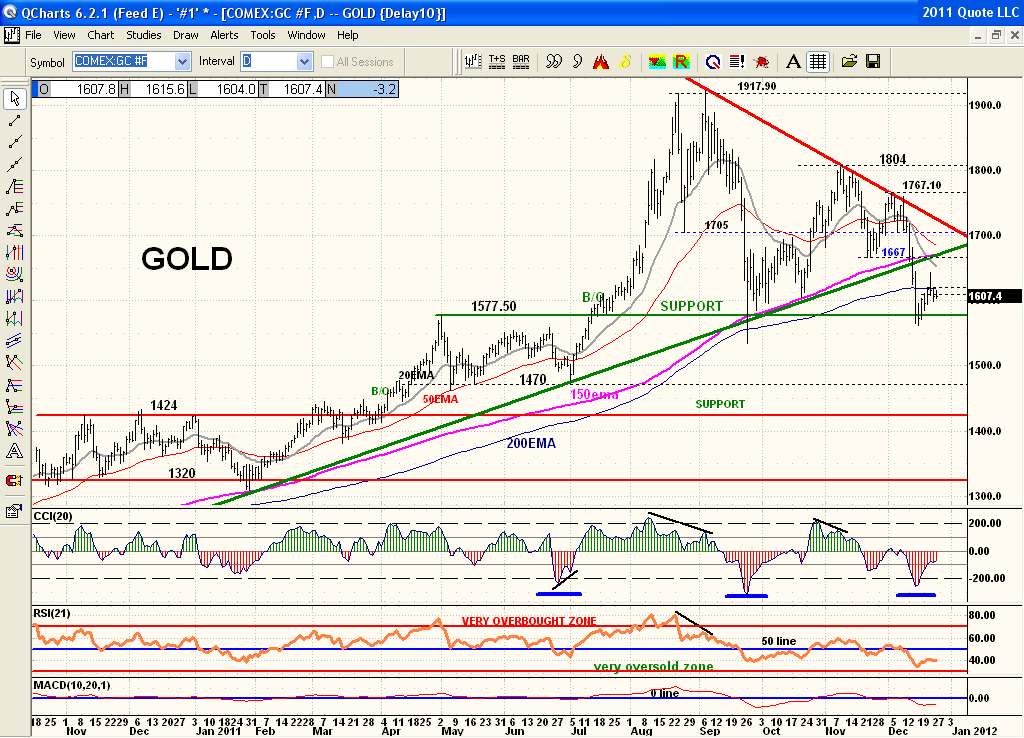
Gold did pullback to major support and has bounced back somewhat. But I can't help feeling like price is going to roll over and plunge despite this. Note the breakdown of the uptrendline and Symmetrical Triangle. And with the $1577 bottom being tagged multiple times with a declining downtrendline that also forms a Descending Triangle as well with the same bearish implications. And price has for the 1st time in years fallen and stayed below the 200ema as well as gone and stayed below the 150ema that had served as support the last 9 times tagged. Note how the dead cat bounce off major support only came back to the 200ema and stalled. Not a good sign of strength to see this weak bounce. It should have looked like a rubber ball hitting concrete. Another clear chart pattern shown is a Bear Flag complete with a Flag Pole as well. Very good example of one with the vertical plunge the 1st 1/2 of Dec and the tight Flag pattern since. You often see two Flags in a row which also matches up with the other two bearish pattern projections. And look at all the resistance dead ahead even if a rally back actually begins. So while the oscillators are very oversold like previous lows that has never stopped price from selling off further. Resistance is the Nov lows and broken uptrendline at $1667 "IF" price can clear the 200ema. I'd love to be bullish but looking at this chart it is hard to do presently. And the U.S.$ is still very bullish.