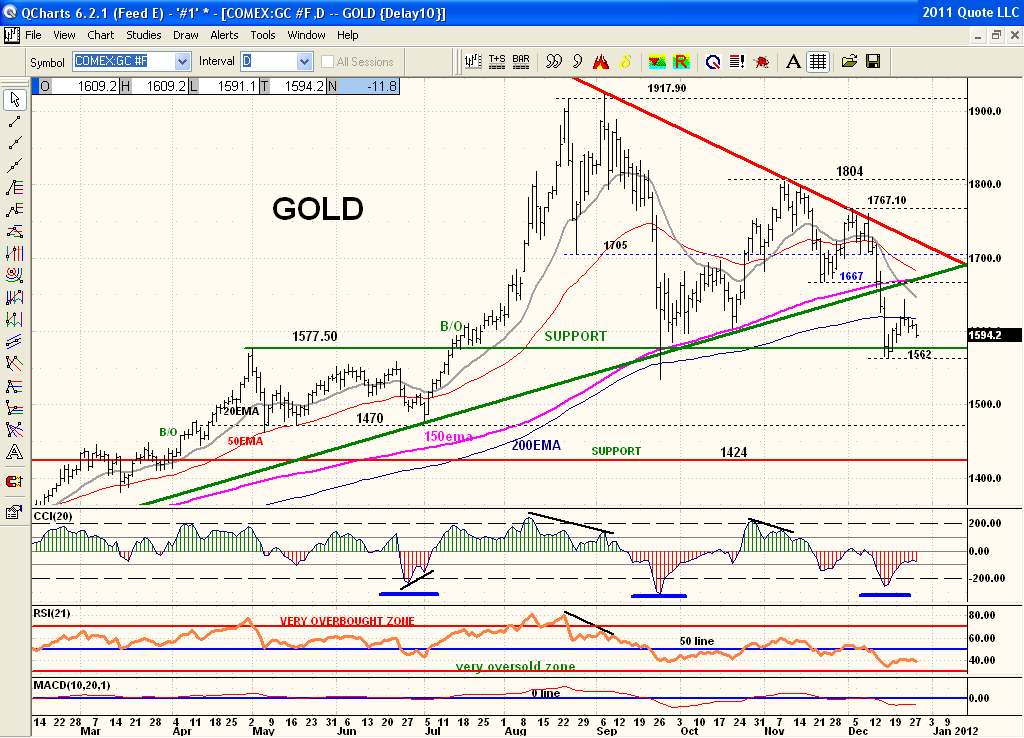
Gold is still displaying a scary bearish chart with the dead cat bounce off price support. Today price is rolling over after this weak bounce to the 200ema. "IF" price breaks below the Dec low of $1562 price will likely plunge. Gold has to get its act together and rally sharply or risk a major decline from here. So far with the breakdown of the triangle and long term uptrendline along with the break below the 150ema and the 200ema this chart looks like it's crash and burn time ahead. The 150ema and 200ema had not been broken on any close for the last 3 years up intil recently! Definitely not a good sign. Most gurus I read are predicting a rally in here but so far that's not what this chart is saying to me. But hey, I'm no guru either,lol. I'll just stay on the sidelines and miss this big year end rally until proven otherwise.