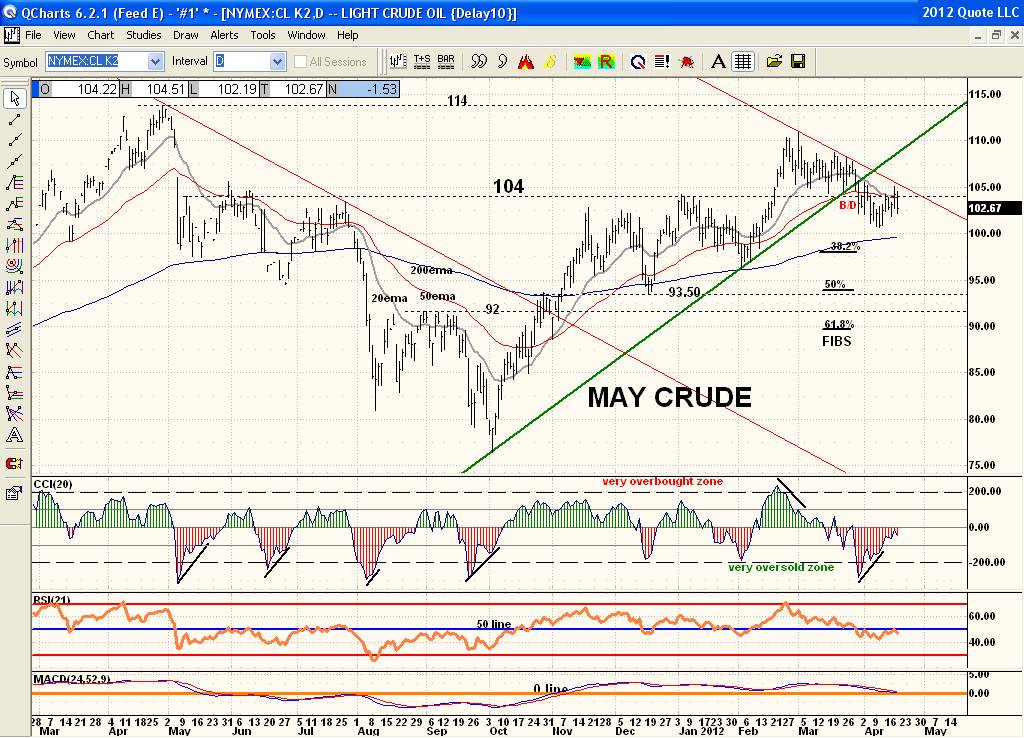
Now here is a delema I'm dealing with presently. See the CCI 20 at previous price lows tag the very oversold -200 and then with a lower price lows have higher CCI readings (pos diverg). Not every time of course as the Dec/Feb and March price lows did not show a higher CCI reading (pos diverg) They only tagged the very oversold zone at -200. Those were very tradable lows just using that BUTTTTTTTTTTTT the April lows did see the same set up I mentioned with lower price lows and a higher CCI reading (pos diverg) just like in May/June/Aug and Oct. Soooooooooo what to do. As always one must default to price support and resistance as that is what is traded. Price must clear $104 once again and hold above that level and preferably clear that short downtrendline to suggest rally time again and a likely rally to a double top at $114. Meanwhile with this pos diverg showing as before I would be very concerned being short even with price bumping resistance at $104. A tight stop above this closing level would be needed due to this indicator. Now price has bounced a bit off its recent price lows and there is no way to quantify 'now much' is enough of a reversal but Crude typically bounces much like it has previously as it is a high beta market. P.S. You are seeing the same bullish pattern on the double short Yen ETF:YCS and a bearish neg diverg with this indicator on the bull Yen ETF:FXY. Much like it showed up on the TBT before it sold off.