Well Lee I don't ever try to be an expert in fundamentals anymore than I try to predict the weather as it is about as successful. So I focus on the charts and seasonals and relative ratio charts etc that leaves a trail to follow.
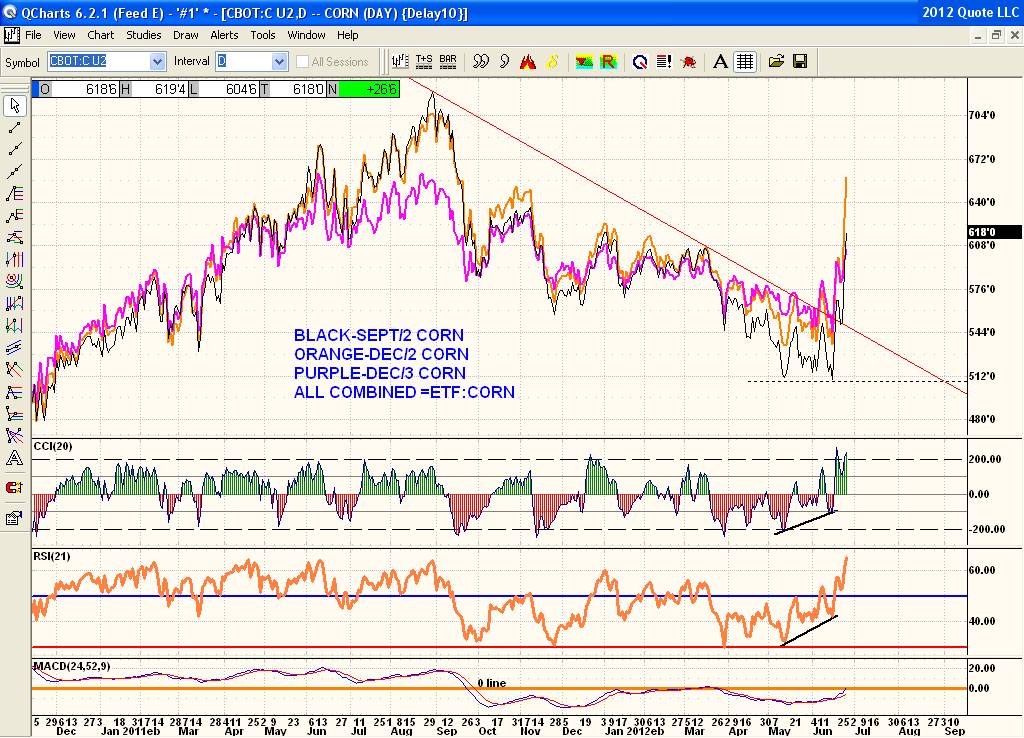
Here is a chart of the 3 contracts that make up the CORN ETF. Note the Dec/2 contract in orange rallied far more sharply than the Sept/2 or even the Dec/3 contracts. That is the reality of the market. You may be able to understand the why but I don't actually care. The combined 3 contracts that make up the ETF balance off the contango well (if that's what you want) Each market has its purpose and risk factor. Just thought you'd like to see this combination of charts to draw your own conclusions.
As far as Nat Gas goes so far the acid test of the 2.22 bottom has been tested successfully and price has come back to the downtrendline.Price could breakout and clear the close by 2.91 and stay in that tight channel between 2.91 and 3.15. This is a typical breakout and consolidation pattern in a tight range just above the breakout pt. Much like CORN did. Same idea and is very typical of breakouts. Then the explosion to the upside occurs. Lots of work left to do for NG at significant resistance but NG hasn't had a decent rally in ages and is likely due for one. Meanwhile resistance is resistance and all the b.s. in the world will never change that fact. Gotta see the breakout 1st and foremost to suggest anything further.