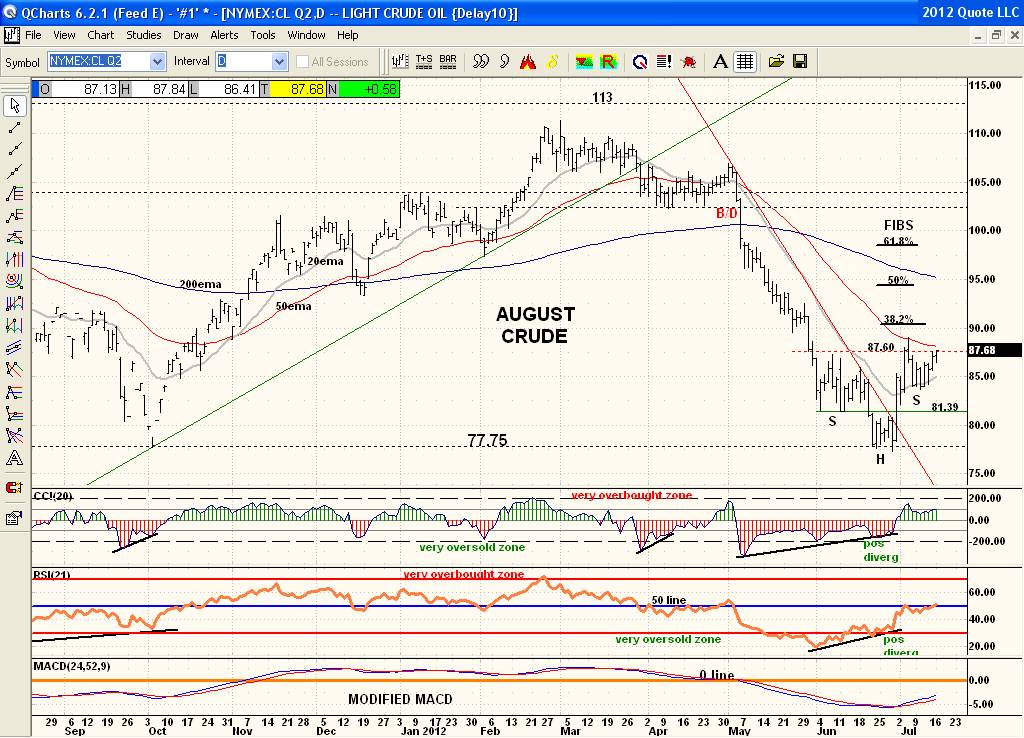
August Crude has formed a very bullish chart pattern. This is a 6 week inverse Head and Shoulder pattern. Price double bottomed at the Oct/11 low and then broke out above its 2 month downtrendline and over the last several weeks has traced out this bullish pattern. BUTTTTTTTTTTT a bullish chart pattern is never a guarantee of higher prices. Price MUST clear and hold above the neckline of 87.60 and even just consolidate above to confirm a breakout. Failure to breakout or worse yet a breakout that fails to hold will turn any bullish chart pattern into very bearish one. Price must prove itself and "clear and hold" above a breakout point to mean much of anything. Historically the seasonal trend for Crude is bullish from the 3rd week in July through the 3rd week in August. Meanwhile the 20ema is below the 50ema which is below the 200ema which are all still bearish. And the Modified MACD is below the 0 line and the RSI 21 is below the 50 line. It's all up to price to breakout right here or fail.