Welcome to the TFC Commodity Trading Forum.
Please feel welcome to join in on these informative ongoing discussions about trading futures and commodities.

The Trading Forum is intended for the open discussion of commodities trading. The management of this Forum does not agree or disagree with the ideas exchanged, and does not exert editorial control over the message posted herein. Read and post at your own risk. The risk of loss in trading or commodities can be substantial. We discourage the use of this Forum to promote trading that is acknowledged to be risky. Please note: many links from the Forum lead to pages on other web sites. We cannot take responsibility for nor endorse the information presented on those sites.

TFC Commodity Trading Forum

Re: Aug Crude/Bullish Chart/Breaking out *PIC*

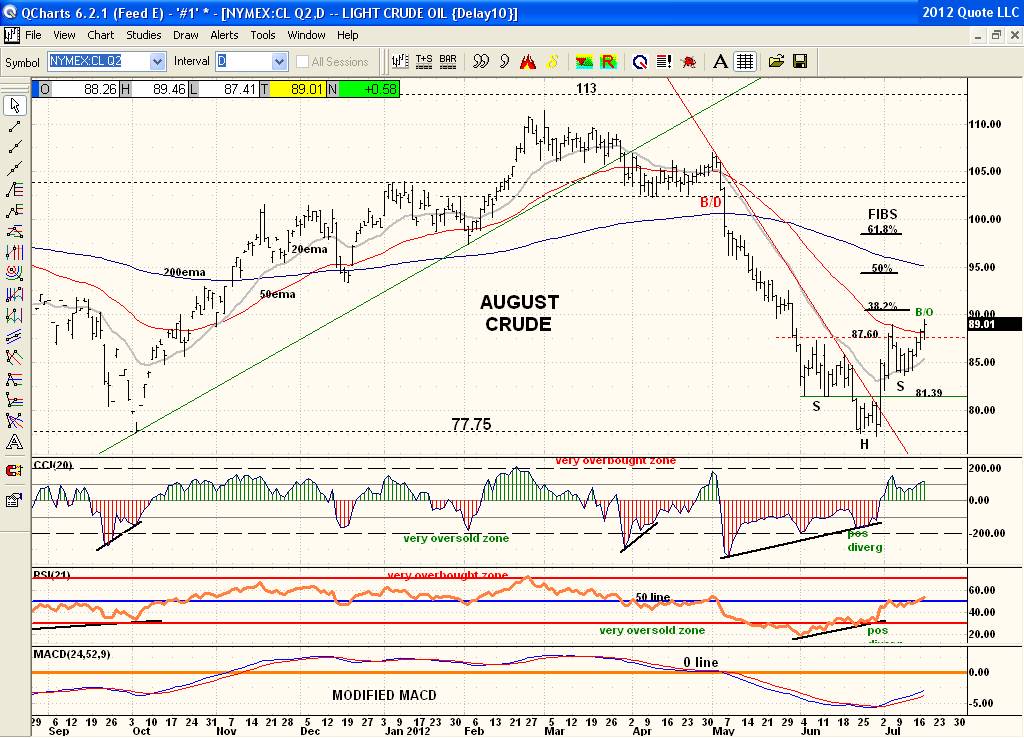
Aug Crude is breaking out of its bullish Inverse Head & Shoulder pattern. Nice price action. Price must hold and at least consolidate above the 87.60 neckline to confirm. So far a very typical reaction to a bullish chart pattern. Staying above the neckline will turn the lagging indicators up again. Crude is not the only market with a bottoming pattern and bullish chart.

Messages In This Thread

August Crude/Bullish Chart Pattern *PIC*
Re: Aug Crude/Bullish Chart/Breaking out *PIC*