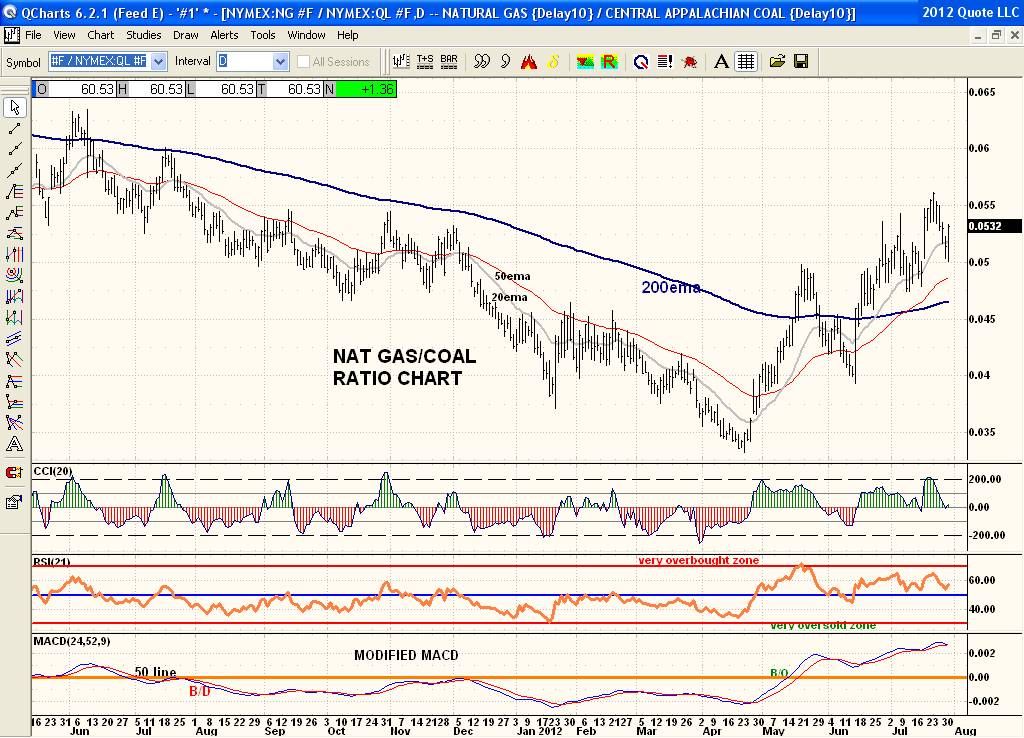
Here is NG/COAL Ratio chart which makes more sense when following NG closer being it is in an uptrend 'relative' to Coal. I like to have at least a year or two on a chart because everything is relative and a long term chart tells so much more than just the last rally. I dragged the chart backwards and see that the last time this ratio was above the 200ema for any length of time was two and a half years ago back in Feb 2010. That 200ema has a long track record of stopping a rally in its tracks. Rarely see price above it for more than a few days before it plunges again. This time price has been above the 200ema for six weeks now which is rare and significant I suspect. But again it is usually the death of NG when it occurs. Just something to keep in mind. So far higher highs and higher lows. And since June the rising 20ema is above the rising 50ema which is above the rising 200ema which is bullish. Even the oscillators are above their center lines. So far so good for NG even with the ratio chart. But this chart will continue to show the 'relative' relationship of both.