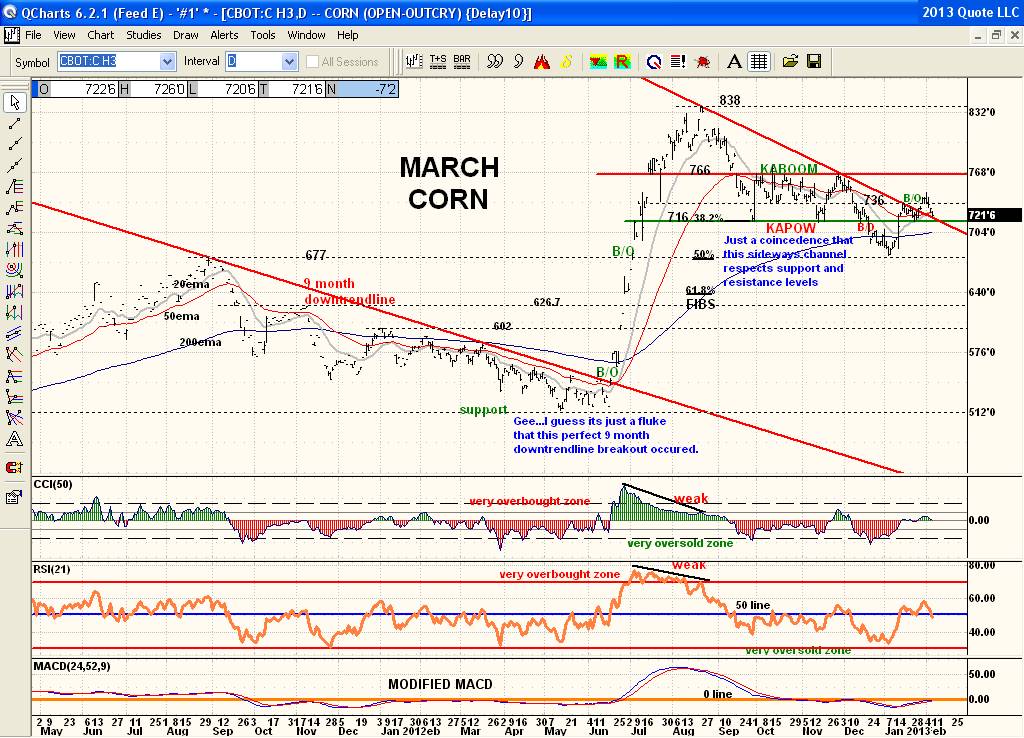
1st of all no one cares who was 1st on this board. Doesn't mean crap. You think that gives you status,lol. It takes more than that. And it also doesn't mean you understand what a chart is telling you. Just like the oldest man in the world isn't the smartest. If you had any understanding of markets at all you'd realize the big money traders of the world are light years ahead of you in weather related markets and don't just listen to the next radio broadcast. They know exactly what the odds of rain or no rain are along with supply and demand and the alternatives to each market. Only a fool would think they are ahead of those big players that are plugged into all aspects of the market more than the run of the mill trader is. The charts are the only set of tracks that will show what they are doing. And the charts are the only thing that can't be camouflaged. You are dreaming if you think you can outsmart the big players in any market. If the erratic weather patterns and other changing fundamentals determined everything there would be no chart patterns at all right? How could there be then! I've been posting these charts of Corn and Nat Gas for a long time including the Dec and March Corn chart that I said would likely track sideways way back in September. Here is the very same chart! Notice the chart ignored all the various weather patterns that occurred! Nice sideways channel after a major run up that is typical just as the chart suggested. Then a breakout below the channel that sold off to support and now a rebound. The market didn't seem to pay much attention to your weather stories did they....................... Just like Nat Gas testing support and resistance levels. If you understood chart patterns you would know what the patterns are saying. You clearly don't understand their message. I'd suggest you don't read my posts or look at my charts and comments as they wont do you any good anyways as you just don't understand them. Some people never do. . I almost never read your posts as if anyone read one post they've read them all as you say the same old thing everytime. Perhaps that's why no one ever asks you for anything.......