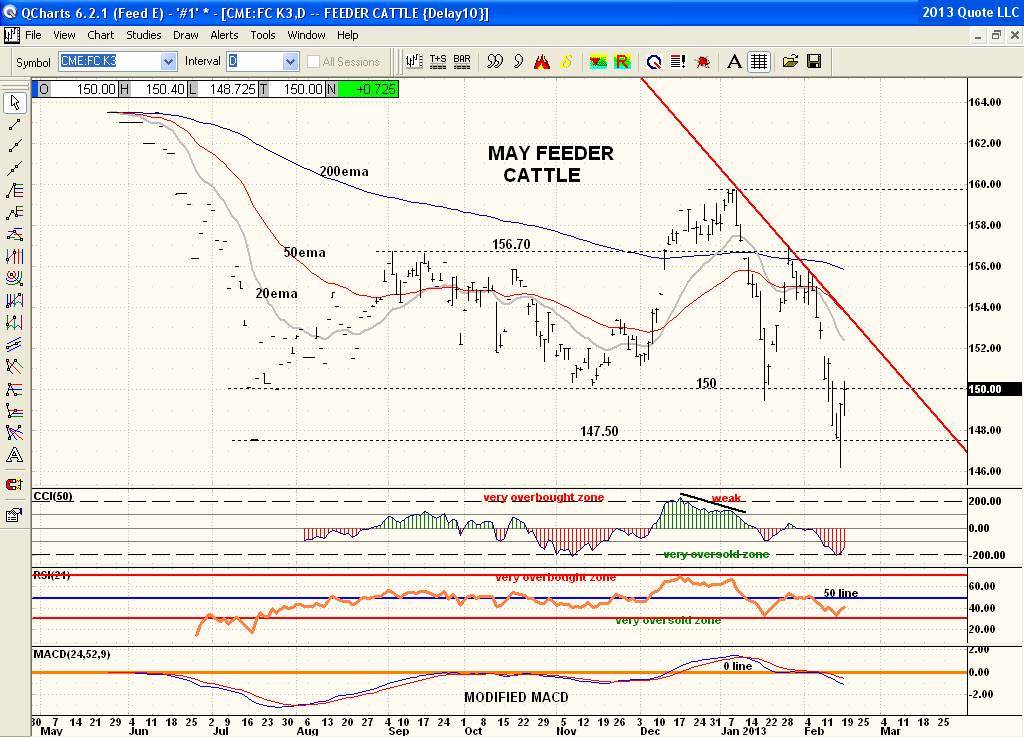
Been out all morning walking up and down mountain trails so just saw your post. Here is what I see technically. Price has been in a downtrend since Jan as marked with the downtrendline and falling moving averages. The falling 20ema is below the falling 50ema which is below the falling 200ema meaning the Daily chart is clearly bearish. Price broke down below the 150 support level in Feb and then bounced off the July contract low support of 147.50 after an intraday spike below with technicals at the very oversold level. Price is now testing broken support at 150 which is now resistance and spinning its wheels there. Price could break through 150 again more easily due to the very oversold level its just been at and then run up to the downtrendline resistance. But resistance is resistance so until it clears 150 again I would remain bearish with the idea of getting long on a bounce back to the downtrendline "IF" you are a short term trader. But bottom line is this chart is very bearish but bouncing back from a very oversold level. Historically seasonal trends are bearish right into March and even April.
Also see Seasonal Trends link bottom left of post.