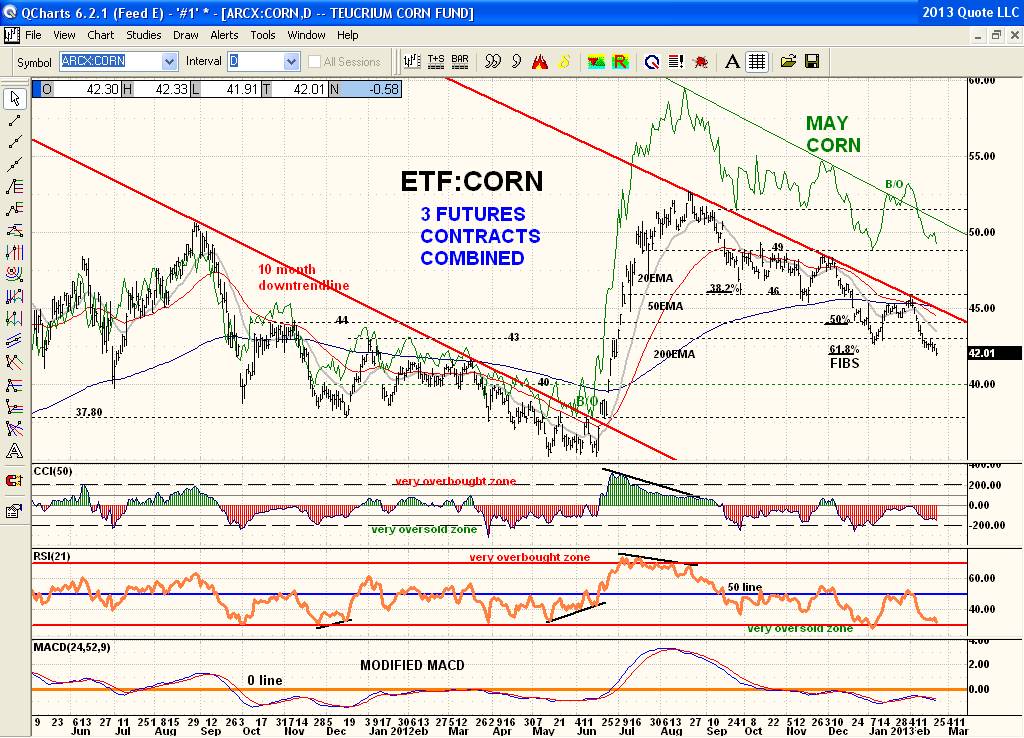
Exactly. Here is the Daily ETF:CORN with the May Corn contract overlaid for a better view of the techncials on the ETF. The May contract shows the false breakout & failure to test it and is approaching the double bottom that the ETF has already broken. Corn has been a sick puppy according to all the technicals since September. Note the lower indicators all falling below their center lines not long after the August top. Also note the CCI showing a major loss of momentum on the August top with the negative divergence and then breaking below its centerline mid September. Also note the long term Modified MACD rolling over and crossing down shortly after the price top! And the 20ema crossing below the 50ema in mid October just to confirm. Plenty of warnings of a downtrend right after the August highs. Right now despite the breakdown of the early January low on the ETF price has reached the Fib 61.8% retracment point of the entire June to August rally. Could be support there. Only thing bullish that I can see here is the obvious backwardation of the back month contracts right through 2013. Here are the contract months showing this. But price is king and until price can clear the downtrendline and the technicals improve if it looks like a bear and acts like a bear it is probably a bear.
Corn Futures EOD
Delivery Symbol Expiry Date Last Chg % Chg Open High Low Settle Open Int Vol
Mar 2013 /ZCH3 Mar 14, 2013 700.25 0.00 0.00% 692.00 701.25 690.00 700.25 227035 109.31 k
May 2013 /ZCK3 May 14, 2013 695.75 0.00 0.00% 689.50 696.25 684.75 695.75 448120 106.35 k
Jul 2013 /ZCN3 Jul 12, 2013 682.00 0.00 0.00% 681.75 682.75 671.75 682.00 214527 38.46 k
Sep 2013 /ZCU3 Sep 13, 2013 580.50 0.00 0.00% 582.00 582.00 571.25 580.50 79429 10.03 k
Dec 2013 /ZCZ3 Dec 13, 2013 560.75 0.00 0.00% 553.00 562.00 553.00 560.75 279953 29.71 k