G'Mrng icd .... different computers but still in the same place.
hope all is well with you. They say I need a hip, lol.
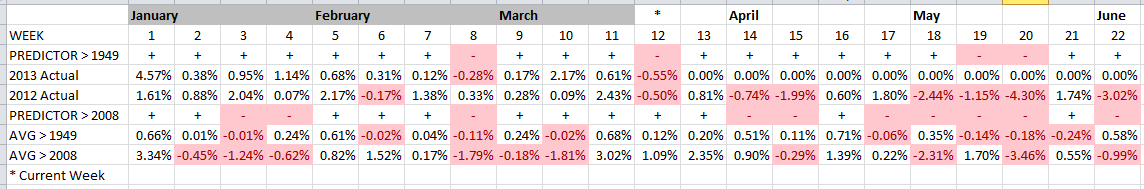
PREDICTOR>1949 is a 2013 $SPX prediction of weekly close direction (only) based upon $SPX time-series data back to 1950. If + the $SPX is predicted to close positive for the given week. If - the $SPX is predicted to close negative for the given week. 2013 Actual shows the 2013 $SPX weekly closes. So far PREDICTOR>1949 has predicted every week in 2013 with 100% accuracy. So far, week 12 is no exception. Will week 12 end by following the 1949 prediction (-) or the 2008 prediction (+)?
Will Q213 (weeks 14 and beyond) follow the path in PREDICTOR>1949 or the path predicted using data back to 2008? Q2 2012 $SPX actuals were weak and Q2 $SPX historical performance dating back to 2008 has been weak. If Q2 was weak in 2012 with the Fed's pump turned on will Q2 2013 be a repeat?
During much of Q113 I wondered why the Q2 predictions using $SPX data back to 2008 were so different than the predictions using $SPX data back to 1950. Was it the Fed's liquidity pump being turned on sometime in 2007/2008? With the advent of the Cyprus debacle this weekend it occurred to me that perhaps Q2 represents the seasonality of bad news from the political bodies in Europe. If this hypothesis holds true, perhaps beginning week 14 the PREDICTOR>2008 model begins to more accurately chart the course of the $SPX? If this holds true PREDICTOR>2008 leads our way to a repeat of 2012 Q2 in which April 1 is the top and we drop to a low in June 1. The drop in 2012 was just about 10%.
Beginning week 12 in 2012 the $VIX rose by 35% across this and the next 3 weeks.
Let's see what happens.