Hi CeeJay,
I'm still stewing on all of this ...... You know that I am a "believer" in the charts and the "seasonal trend" is
still DOWN through August, save the couple of bumps during first half of the month.
If you looked at Trades last Sept. Ng chart - T'IS NICE, but I wouldn't write off the possibility of at least
a healthy pull back for at least a day. Nothing goes straight up !!!
If the Ng buyers for the "peaking plants" were listening to tonight's news maybe we will see something show
up in "price". What I just heard was above 90 in 40 states for rest of week. Certainly agrees with your observations.
No clue "how/when" they do their buying for something like this week but it certainly should show up in the EIA
report for "next week". The data for this weeks report is already in the can.
Some additional "food for thought".
The Salem 2 Nuclear plant (1158Mw), South Jersey, was shut down Thur. over a small water leak while testing some
plumbing. Apparently not serious and plant may be back up Mon. AM (maybe not). In any event,
PSE&G uses Ng for backup and that would be several days of pretty hefty Ng usage unless they grabbed
cheaper power off the grid over the weekend ?? [Have work to do in this arena, like how much Ng is burned per Mw
generated ??]
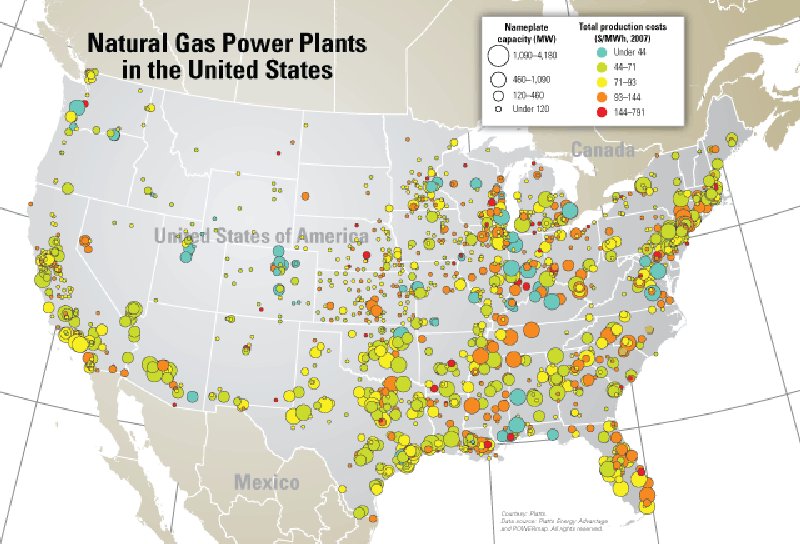
Included a Map of US Ng Power plants that I found. (circa 2007). Would be interesting to be able to
overlay your weather predictions on this map. Does paint a pretty clear picture of where the Ng demand is.
Take care of the broken finger - no need to type Caps !!!
Thanks, Lee