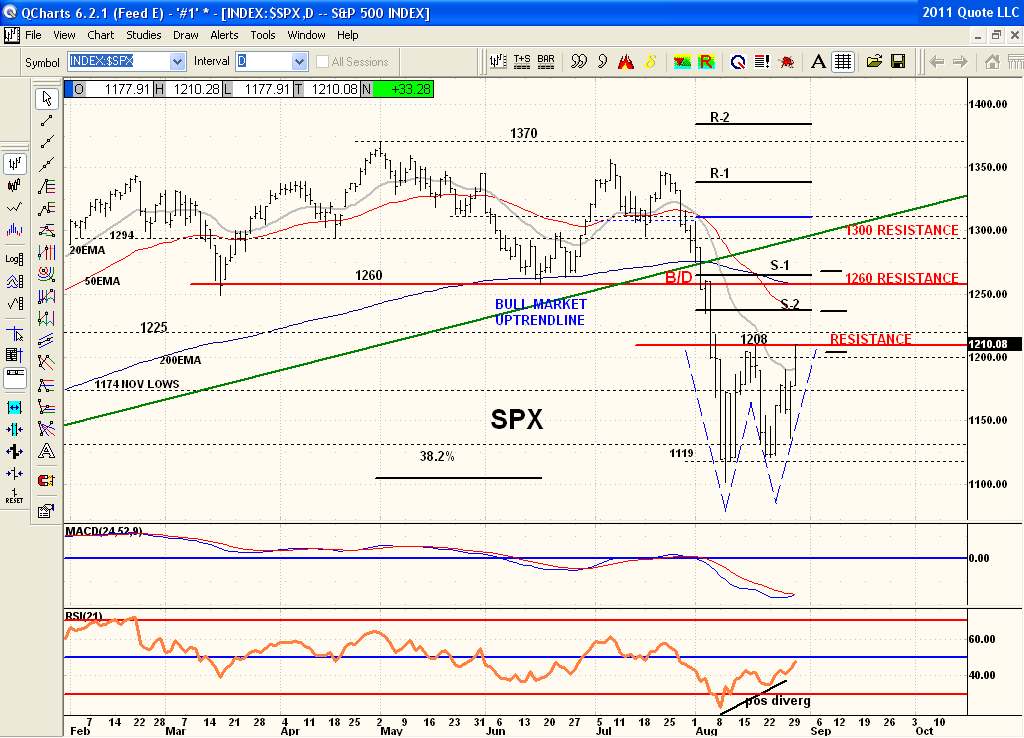
Here is the SPX. I've marked the "W" pattern the market has traced out with blue dashed lines. This is a bullish pattern when seen BUTTTTTTTT ONLY "IF" price can clear the top resistance line at 1208 clearly AND hold above. That would suggest a run to the 1260 resistance pt which is the March and June lows resistance but price could easily run up to 1300 which is the broken bull market uptrendline resistance point. That is also the mid July and Mid April lows breakdown pt resistance as well as being the depth of the W pattern being 100pts. So from 1208 to 1300 would be your 100pts. Just above 1300 round number is the main Pivot for August too. With this level of oversold it would not be unusual to see this. But as I said the SPX must prove itself from this top of the high volume price range between 1101 and 1208 to breakout and show what it's made of. Failure to do this would see price stay in this range for some time.