Re: CT...better get back on target. 😁 *PIC*
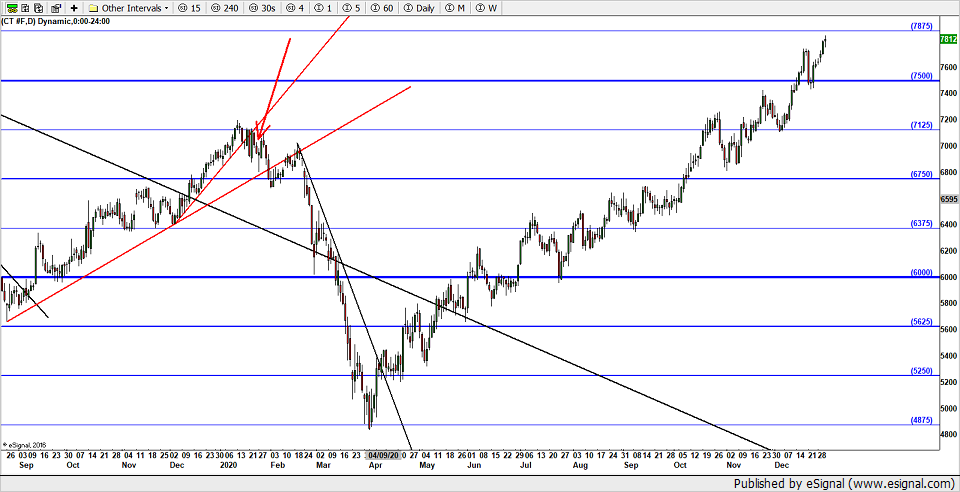
(red arrow) From 1-26-20: "well, not a great move on the order of PA but it has gone up to the 71.25 mark and commenced machinations there as there was suspicious might be the case.
It looks like a possible beginning of a longer term top."
I seem to have two threads running for Cotton. Oh well...
I'll pick this one to go with. Linked to a daily chart posted 1-26-20...11 months ago. I was talking about a possible long term top at 71.25. That's where the red arrow is in time on this chart. 1-26-20. There was a long term top made...if you count a 3 month trend down as making long term top it left from. Your call...I think it could be a medium term move...whatever. 3 months...down to 48.75.
Unfortunately, I don't very often look at the CT chart and failed to see the definitely long term up move that ensued following the three month down move. 9 months up, more or less and is still going.
When price gains or exceeds one of these geometric horizontal lines you should expect it to go to the next one. Like...if price gets on top of 30...next stop 60. If 60 is gained then expect 90 and so forth. Not always will it do this. It might get hung up at a halfway or quarter point. Like it did at the top at 71.25. Price was headed to 75 but got stopped.
When price attempts to make one of these lines and stalls out and breaks a trend most current trend line...such as it did at 71.25...be suspicious of a change in trend. If it makes that line...ie. gets above it and then breaks the trend line...figure on it going sideways but as long as it stays above te line going sideways...be suspicious of continuation in that direction...just maybe at a less steep upward angle.