Interesting little movement covering the last 5 months...going exactly nowhere...fast. These little types of movements makes me think there's a lot of churning going on in there. Selling of positions at about the same rate as buying. Chopping up the same ground. I usually leave charts like this until this thing resolves itself into a readable pattern. At least readable to me...it may mean something serious to some of y'all out there.
I used to thing it was the beginning of a change in trend because it looked like churn but many times it just continues in the same direction. The slow grind...my nephew calls it.
Could slow grind down with a blow off down spike...could slow grind up with a blow off up spike.
Could do squat. I do not like slow grind fake churn and ham, said Sam.
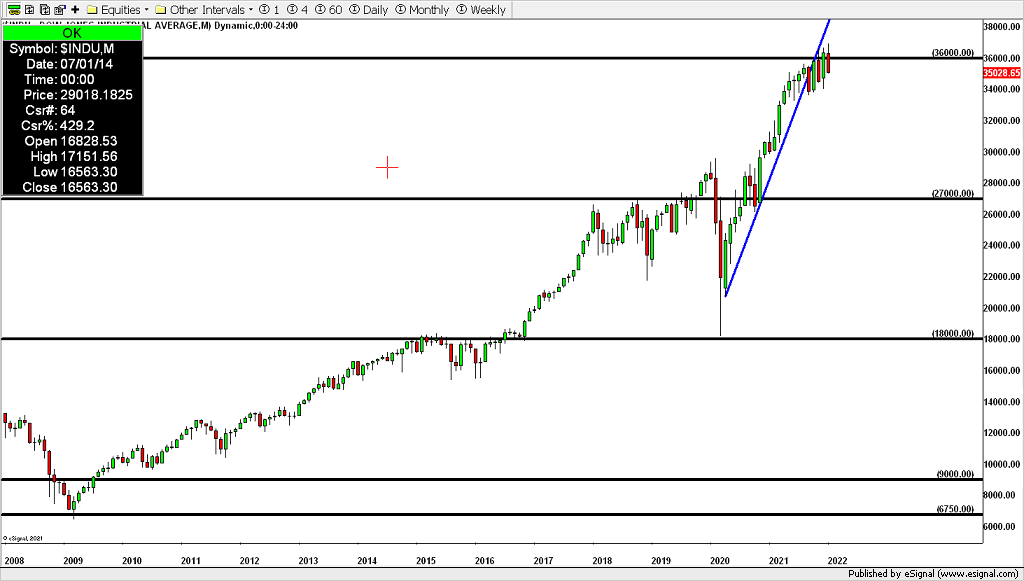
The grind being below the lastest fastest moving uptrend line...ehh. Means bupkiss...until it means something...after the move it was building up to. Notice though, I start the trendline at the bottom of the first higher low here...instead of the big burp down stick that briefly took prices to 180. That was the last candle of a time cycle with the higher low candle being the beginning of a new time cycle or at least a change in time period in the longer time frame...ever how you want to look at it.
If you let fundamentals infect your view of the chart...inflation, labor force, gas prices, etc, etc. One might tend to think we're in for a bust. If you look at the chart from a pure chartest view point...it's in a honking big assed bull market since way back with no real indication of a crash to come. Of course, that's when they come.
If the big dogs decide its short time...they don't want the masses catching on to that...so they quietly churn away...then it breaks down and Joe Blow starts to panic when they see their nest egg eroding in 10K chunks...panic selling ensues driving prices down harder for the big dogs short positions to make big fast money. Maybe.
I got nothing here. Wait and see...take a pee.