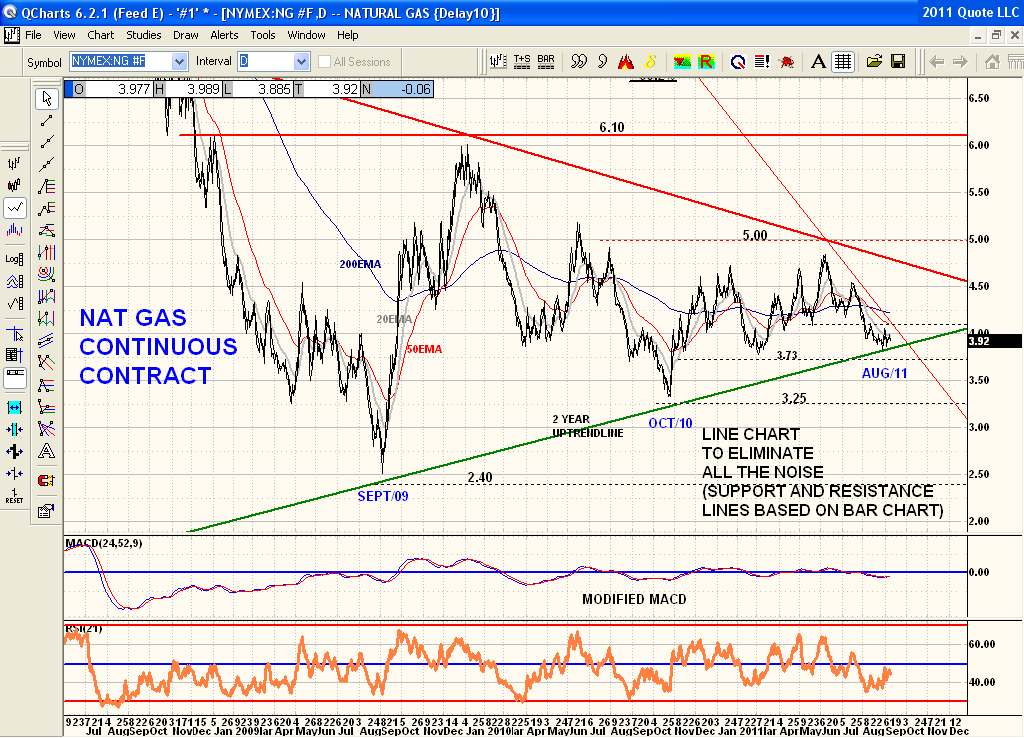
Here is the Nat Gas Daily continuous chart as I posted yesterday only as a line chart which shows closing prices only. This gets rid off all the noise but the support and resistance lines are as before and based on the bar chart. Price has settled down and is no longer volatile. But in doing so price has also consolidated into a tight range that historically doesn't last long. Price is now sitting right at a 2 year uptrendline plus right at the typical fall lows as in 2009 and 2010 so it's at a critical point in time and price. NG must now clear the 1st resistance point at 4.15 to even suggest a rally to the major downtrendline at 4.75. And at the same time it can't fall any further without a major breakdown below its 2 year uptrendline. A clear break below the March lows of 3.73 would be a very bearish breakdown and suggest the bear will continue. At least now price has been cornered and any movement at all that is visible will have consequences.
Shall I say the 2 words?????????? (OPTION STRANGLES!!!!!!!!!!!!!!!!!!!!!!!!!!!!!!!!!!!!!)