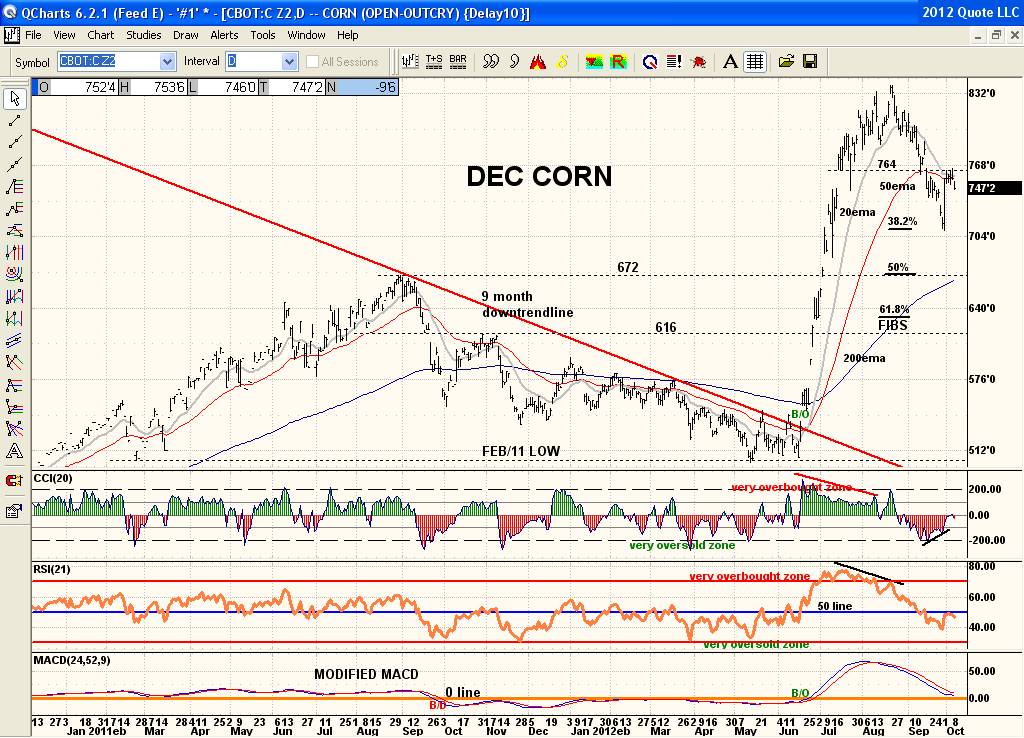
I don't normally even look at the Grains as they can be explosive,erratic and volatile and as much of a gamble as an investment. The Grains trade like the Biotech stocks if you want an analogy. But according to the chart price rolled over after reaching very overbought status mid July to mid August and weak technicals below showing strong negative divergences. Price since the highs has rolled over nicely but has found support at the Fib 38.2% retracement level. Resistance is being seen at 764 which is also the 20ema area. Price has been finding the 20ema resistance since early Sept which is typical for most markets. More volatile markets will violate the 20ema but still find it acts as support or resistance depending on what side price is on Key now is for price to either breakout over 764 or break below the latest price low of late Sept. That 764 is showing its resistance there with many indicators such as the 20ema plus see the CCI 20 continuing to hold below the 0 line and roll over after tagging it again and the RSI 21 roll over as well when coming back up to the 50 line. Bottom line: to be bullish again price needs to clear and hold above 764. Until then the chart is bearish. Seasonals won't likely help much as historically a low is seen in early Oct and a rally runs right through spring. But with recent events the grain world has changed with recent highs so one can't expect the seasonals to get on track off a high that should be a low. That's all I see with the chart fwiw.........................